NJ ANCHOR Policy Simulation Platform
Independent Policy Researcher & Developer
The findings were shared with New Jersey state agencies. The platform's policy brief is addressed to the New Jersey Division of Taxation, which administers ANCHOR, and to the state's Wealth Disparity Task Force.
Sharing the analysis is not an endorsement or adoption of its recommendations; no policy change is claimed.
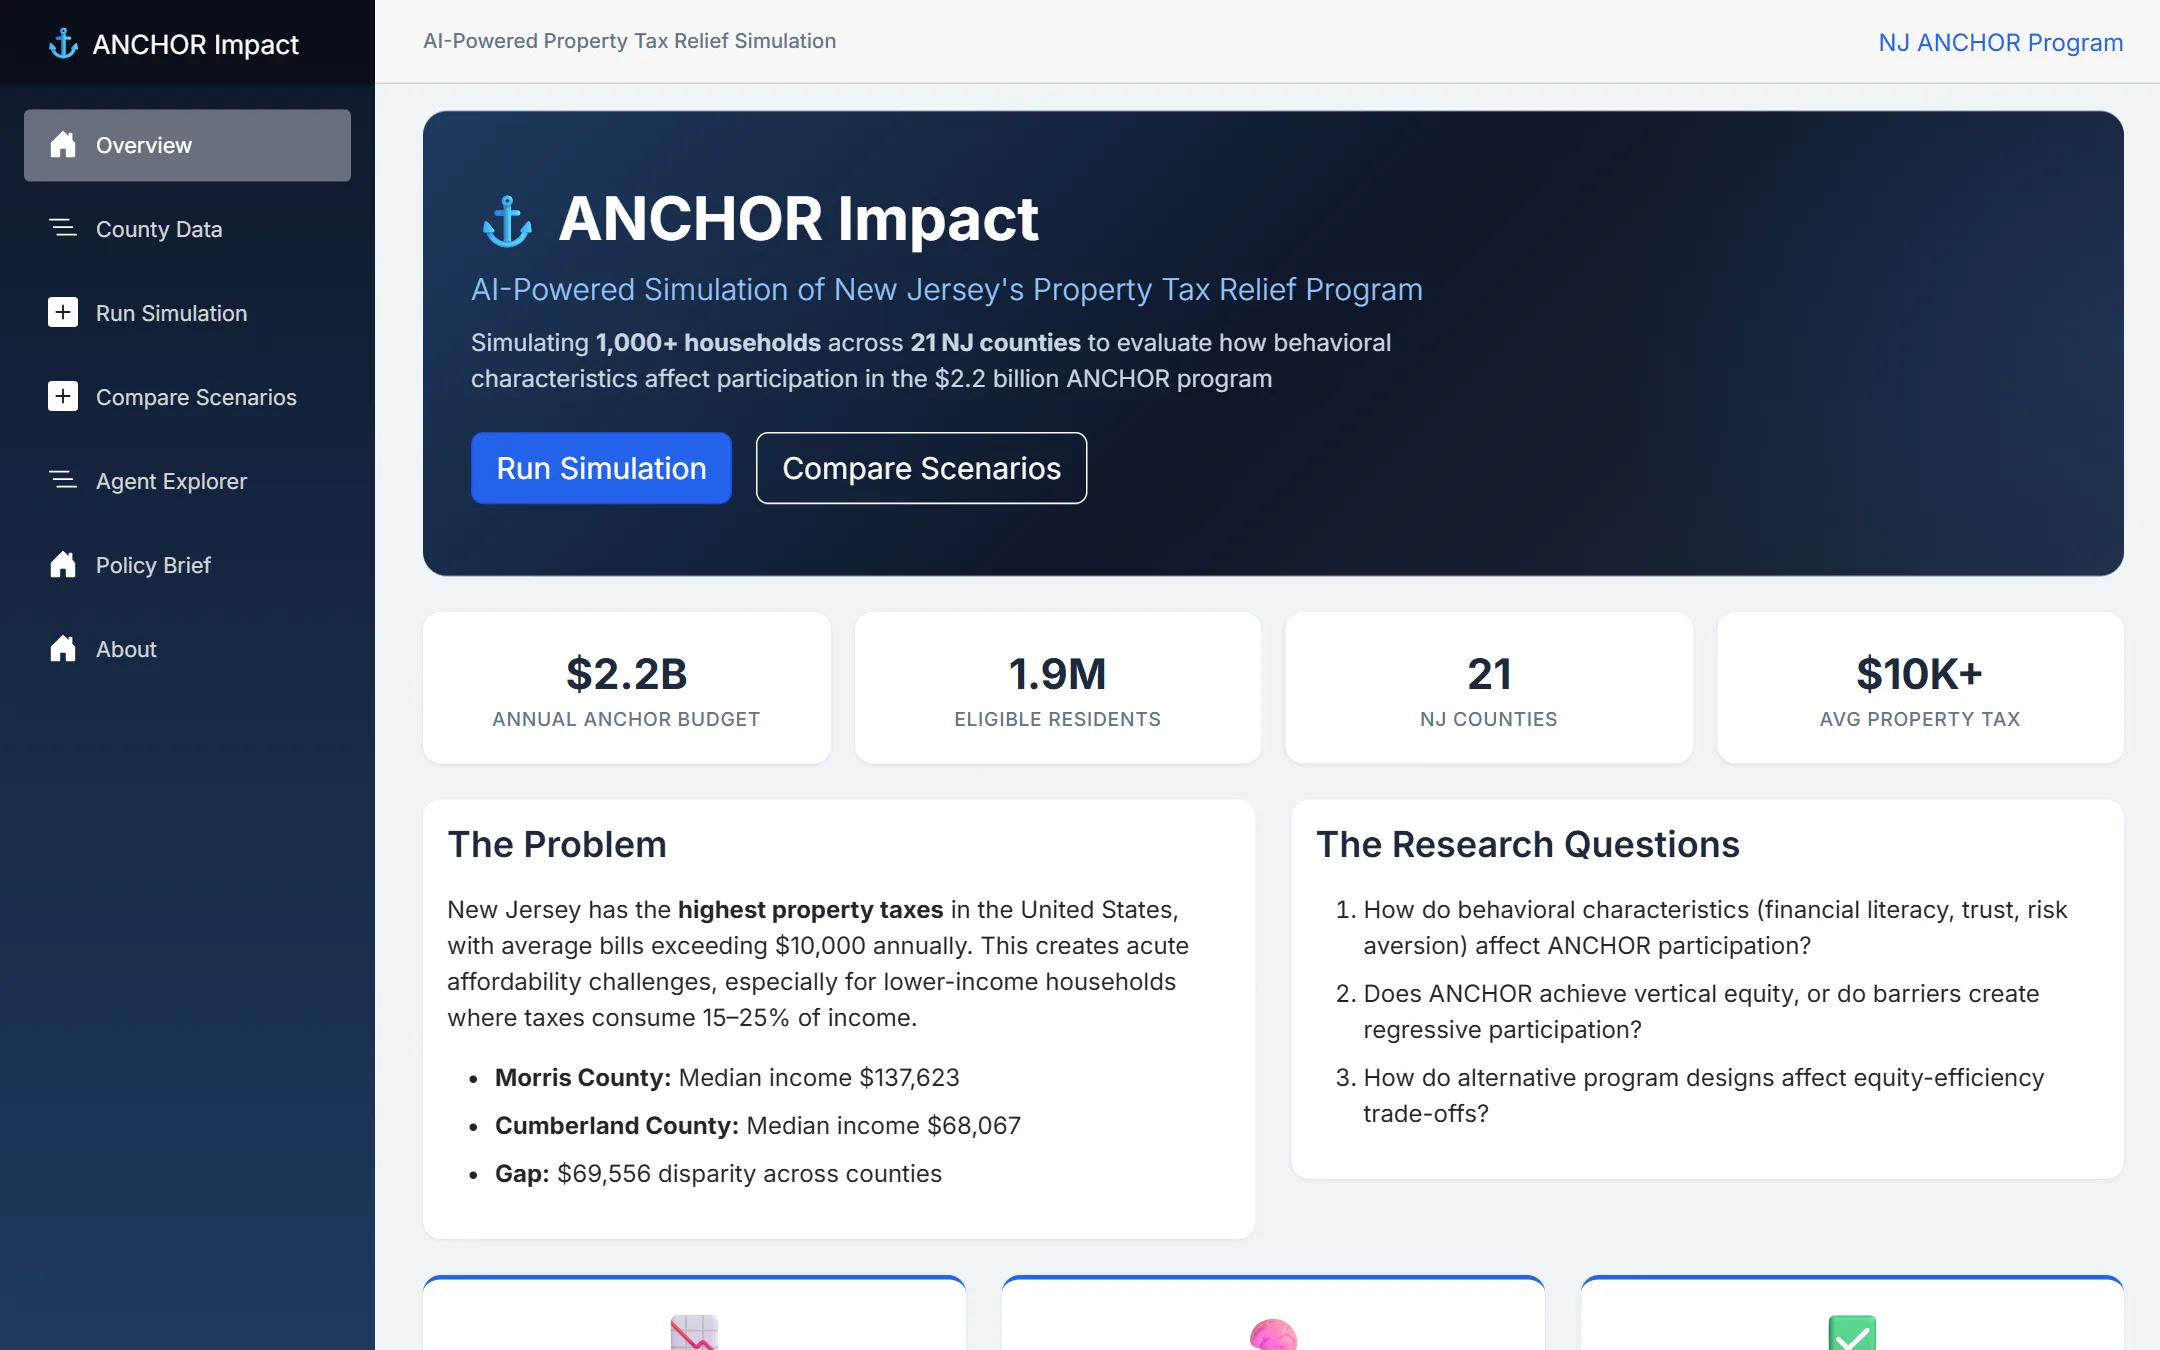
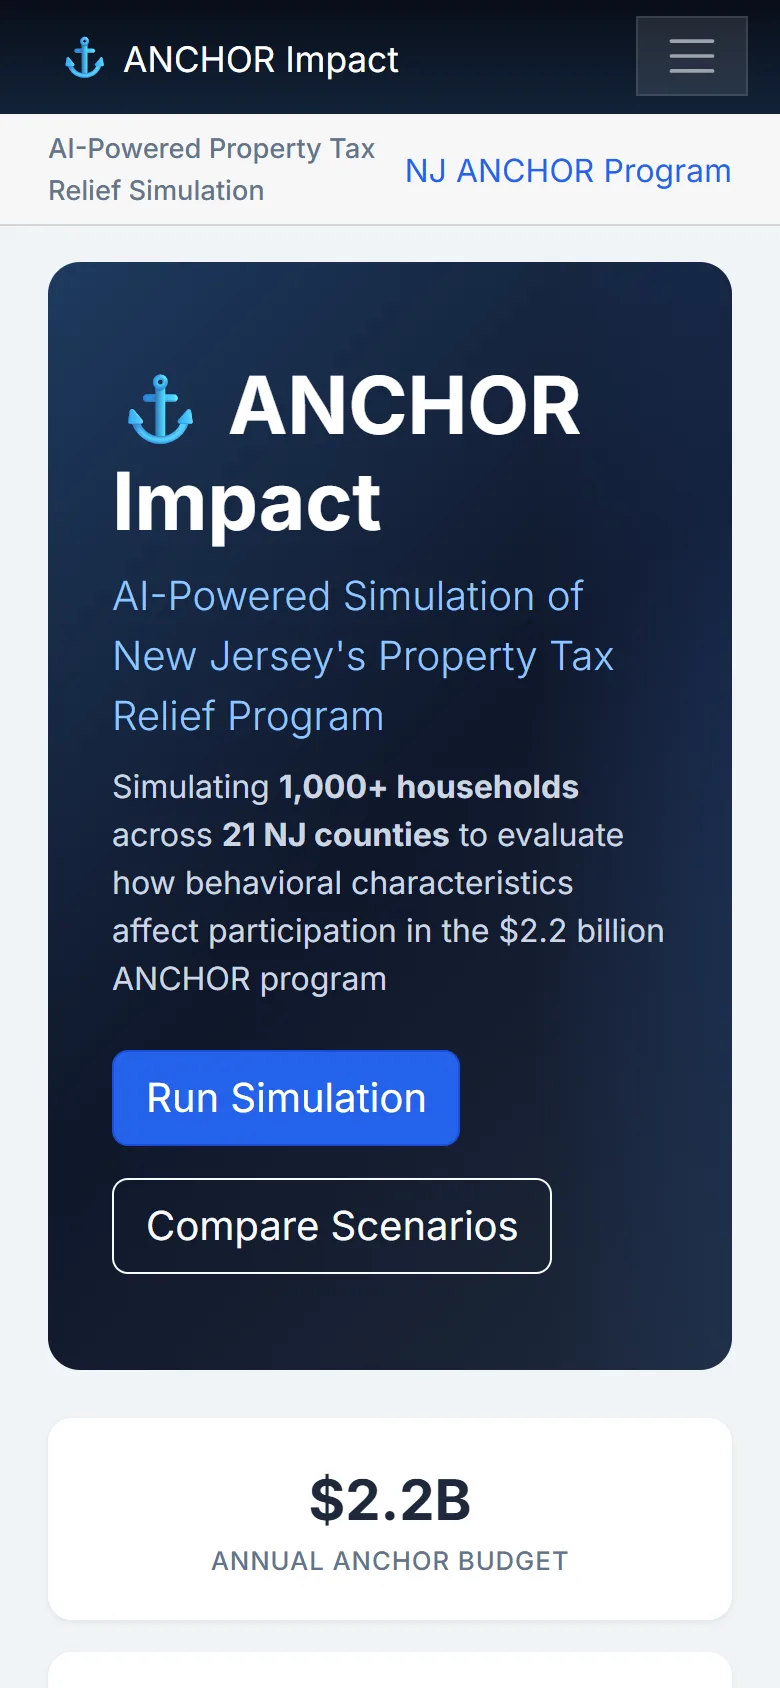
- Annual ANCHOR budget, the program modeled
- $2.2B
- Annual ANCHOR budget, the program modeled
- Simulated households across all 21 counties
- 1,000+
- Simulated households across all 21 counties
- Modeled participation gap: 76% (highest income quintile) vs 49% (lowest)
- 27 pp
- Modeled participation gap: 76% (highest income quintile) vs 49% (lowest)
- Policy scenarios compared
- 5
- Policy scenarios compared
The question
Relief only helps the households that actually receive it. ANCHOR is New Jersey's $2.2 billion property-tax relief program, in a state with the highest property taxes in the country. The project asks why eligible households do or do not take it up, and how the program's design could reach them better.
- How do behavioral characteristics such as financial literacy, trust and risk aversion affect participation?
- Does ANCHOR achieve vertical equity, or do barriers make participation regressive?
- How do alternative program designs change the trade-off between equity and efficiency?
Method
The platform runs an agent-based simulation of 1,000 heterogeneous household agents distributed across New Jersey's 21 counties. Agent incomes are sampled from distributions calibrated to Census American Community Survey 2024 county data; behavioral parameters (financial literacy, trust, risk aversion) are calibrated to the Survey of Consumer Finances and Pew Research data. Application decisions are modeled with behavioral probability functions that include complexity aversion, present bias and social-proof effects. Fixed random seeds make every run reproducible.
Five policy scenarios are compared: no relief (baseline), the current ANCHOR design, a simplified 10-minute pre-populated application, automatic enrollment, and benefits tiered by tax burden.
What the model shows
In the simulation, eligible lower-income households participate at 49% against 76% for higher-income households: a 27-percentage-point gap, even though relief is worth more to lower-income households. The model attributes the gap mainly to behavioral barriers, led by application complexity and institutional distrust, rather than to eligibility rules.
These are modeled results from public data and calibrated assumptions, not measured participation counts.
Recommendations in the policy brief
The brief proposes three changes, each with its modeled effect, timeline and cost:
- Pre-populated applications using existing tax-return data
- Benefits tiered by each household's tax-to-income ratio
- Targeted community outreach pilots in the five lowest-participation counties
Why sharing it matters
A simulation is most useful in the hands of the people who design and run the program. The findings were shared with New Jersey state agencies, and the brief is addressed to the Division of Taxation and the Wealth Disparity Task Force, so the analysis can inform discussion of program access and outreach.
My role
Independent project. I carried out the research, built the simulation and the web platform (deployed on Microsoft Azure), and wrote the policy brief.